Analytics Strategy for RegalosApp Landing
→ Introduction
As a Product Manager, the primary goal of the Regalos App landing page isn't just to look good—it's to validate the market, capture high-quality leads (beta testers), and understand user behavior.
This document defines the analytical foundation, key funnels, core metrics (KPIs), and tracking strategy we have established. Crucially, this represents our objectives and the framework we use to make data-driven decisions, preparing us to gather actionable insights as soon as traffic begins to flow.
✕ Challenge
The main challenge was to define what user behaviors truly matter for validating our MVP and ensuring we can identify where we lose potential beta testers.
On one side:
- We need to know if our value proposition resonates with visitors.
- We must understand the hardware distribution of our audience (iOS vs. Android) to prioritize development properly.
On the other side:
- We must evaluate which language market (EN vs. ES vs. DE) responds best to our messaging to direct future marketing.
- Without a rigorous tracking setup, any traffic we drive to the landing page would result in vanity metrics rather than actionable product insights.
✓ Solution
We designed a three-pillar tracking strategy to capture every meaningful user action, from the first page load to the final beta signup.
🗺️ Primary Conversion Funnel
Tracks the full user journey from arrival to beta signup. We monitor page_view → beta_view → button_click → beta_signup to pinpoint exactly where we lose potential testers and how to improve it.
📱 Platform Interest & Hardware
Tracks iOS vs. Android selection during signup (platform_select event). If 80% of signups are iOS, we immediately shift development priority to TestFlight, ensuring resources go where user demand is highest.
🌍 Localization & Market Fit
Tracks user behavior across English, Spanish, and German markets. Comparing page_view and beta_signup by language lets us allocate marketing budgets to the markets with the strongest response.
★ Business Results
Our tracking strategy covers 7 distinct events across 5 funnel stages, giving us full visibility into user behavior from first visit to lead capture.
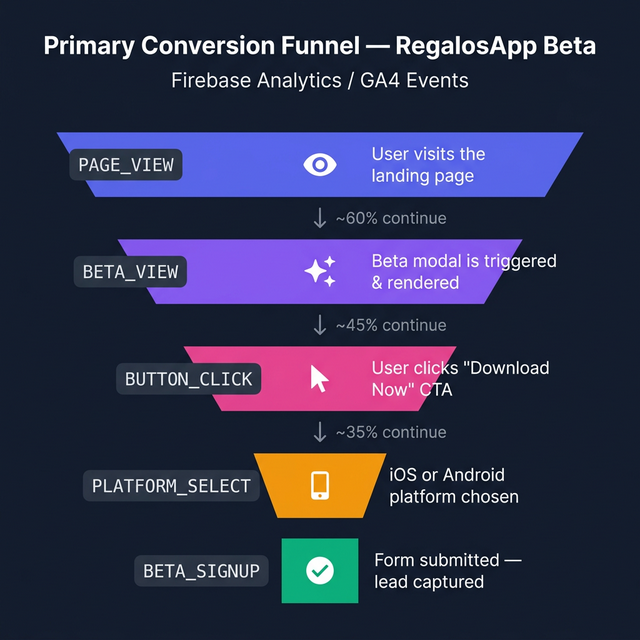
| Event Name | Trigger | Funnel Stage | Why We Track It |
|---|---|---|---|
page_view | User loads the landing page | Acquisition | Top-of-funnel baseline; measures raw reach and traffic quality |
beta_view | Beta signup modal is rendered | Awareness | Separates users who saw the CTA from passive scrollers |
button_click | User clicks "Download Now" CTA | Interest | High-intent signal; shows the value proposition resonated |
platform_select | User selects iOS or Android | Consideration | Determines hardware split to prioritize dev resources |
beta_signup | Form successfully submitted | Conversion | Primary Key Event (Conversion) in GA4 |
waitlist_signup | User opts into waitlist instead | Conversion (Alt) | Captures users interested but not ready for beta |
language_change | User switches UI language | Engagement | Maps market interest across EN / ES / DE segments |
While this is a newly implemented analysis strategy awaiting its first significant data influx, we have established clear, industry-standard KPIs to measure future success and guide our actions.
Targeted Key Performance Indicators
We set realistic goals to evaluate if an experiment succeeded or failed:
- Landing Page Conversion Rate: Target of 5% - 10% (High intent traffic). If missed, we will improve Hero copy or check traffic quality.
- Form Completion Rate: Target > 70%. If lower, we will simplify the fields as the form might be too long or intimidating.
- Bounce Rate & Engagement: Target Bounce Rate < 50% and Engagement Time > 45 seconds. Lower performance will prompt us to improve load speed, visual appeal, and copy clarity.
Strategic Actionable Insights
Once we hit our first 100 visitors, we will run the following analysis:
- Traffic Quality vs. Conversion: Evaluating if high traffic but low conversion means our traffic source doesn't match the value proposition.
- Post-Signup Behavior: The real measure of a beta tester is if they actually download the app. We must compare Landing Page Signups vs. Actual TestFlight/Play Store Installs.
- Long-Term Retention Vision: Shifting focus from Acquisition (getting emails) to Activation (first gift created) and Retention once the app launches.
↻ Project Timeline
The strategy definition and implementation of tracking events followed a structured approach to ensure no critical data is missed.
Phase 1 - Objective Definition
Outlining core goals, KPIs, and realistic benchmarks for the landing page.
Phase 2 - Funnel Mapping
Defining the Primary Conversion, Platform Interest, and Localization funnels.
Phase 3 - Analytics Implementation
Setting up custom events (like `beta_signup`, `waitlist_view`, and `button_click` parameters) via Firebase Analytics / GA4.
Phase 4 - GA4 Configuration
Manually marking critical events as "Key Events" (Conversions) in the GA4 dashboard to ensure they are highlighted as major goals.

Ready to transform your product?
Let's discuss how we can achieve similar results for your business. Contact me at paniagua.ian.de@gmail.com or book a call below.